<<Prev
Index
Next>>
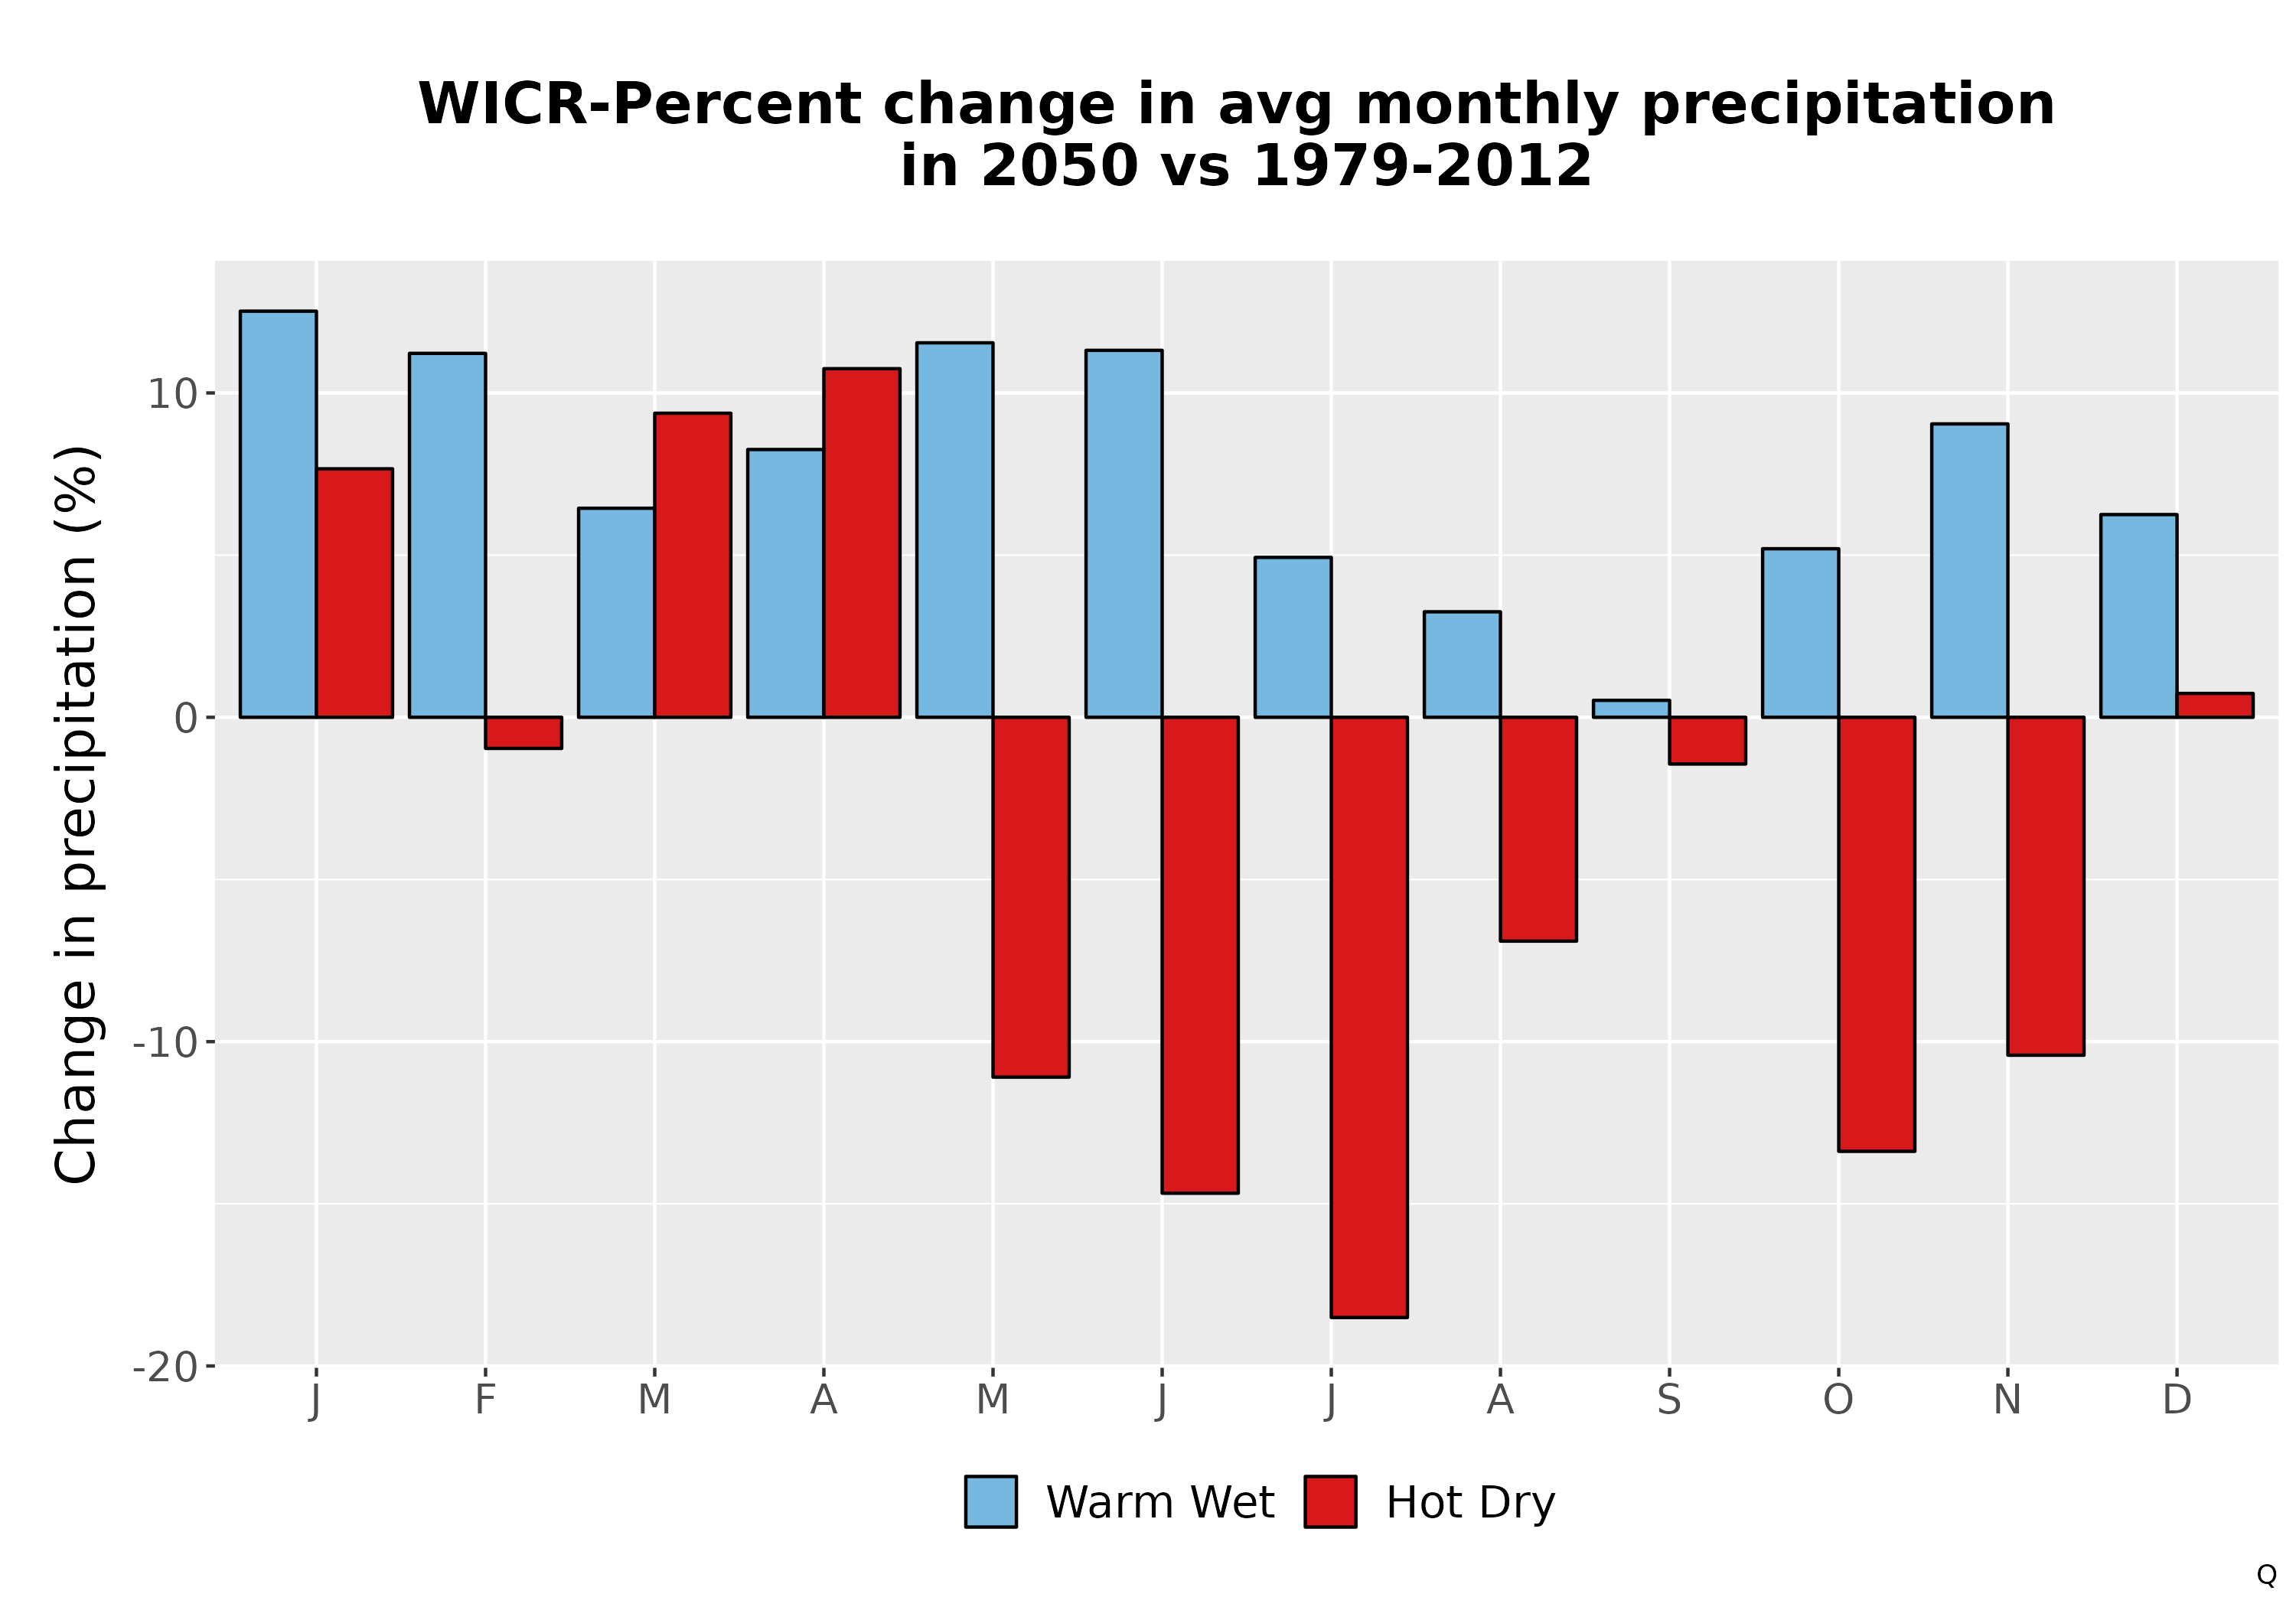
Click the image to see a larger version. This bar graph displays expected percent change in monthly precipitation for the two climate futures compared to a historical average (1979-2012). More information
(3/6)
<<Prev
Index
Next>>