|
|
|
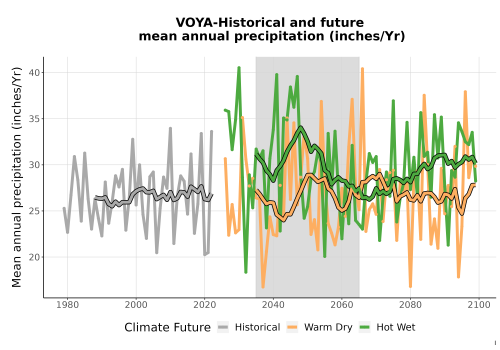
Click the image to see a larger version. Historical and projected trends in total annual precipitation. Bold lines are 10-year running means. Unbolded lines show annual data. More information |
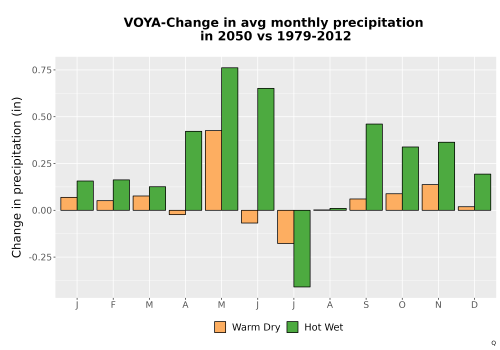
Click the image to see a larger version. Monthly changes (January – December) in precipitation comparing historical vs mid-21st-century. More information |
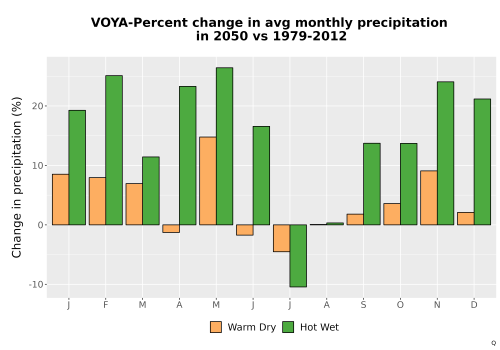
Click the image to see a larger version. This bar graph displays expected percent change in monthly precipitation for the two climate futures compared to a historical average (1979-2012). More information |
|
|
|
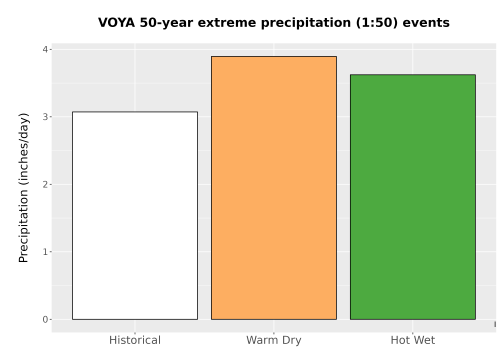
Click the image to see a larger version. Changing magnitude of 1 in 50 year (98th percentile) precipitation events. More information |
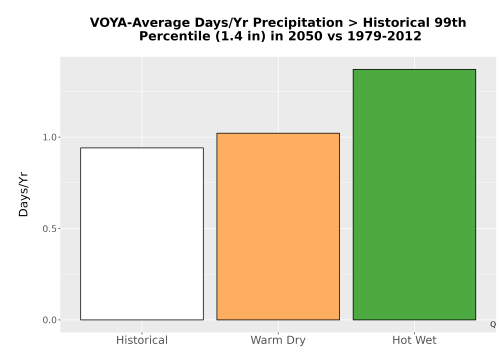
Click the image to see a larger version. Number of days per year with daily precipitation totals above the 99th percentile. More information |
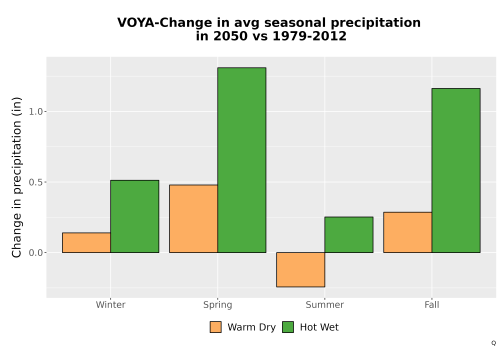
Click the image to see a larger version. This bar graph displays expected changes in seasonal precipitation (inches) for the two climate futures compared to a historical average (1979-2012). More information |