<<Prev
Index
Next>>
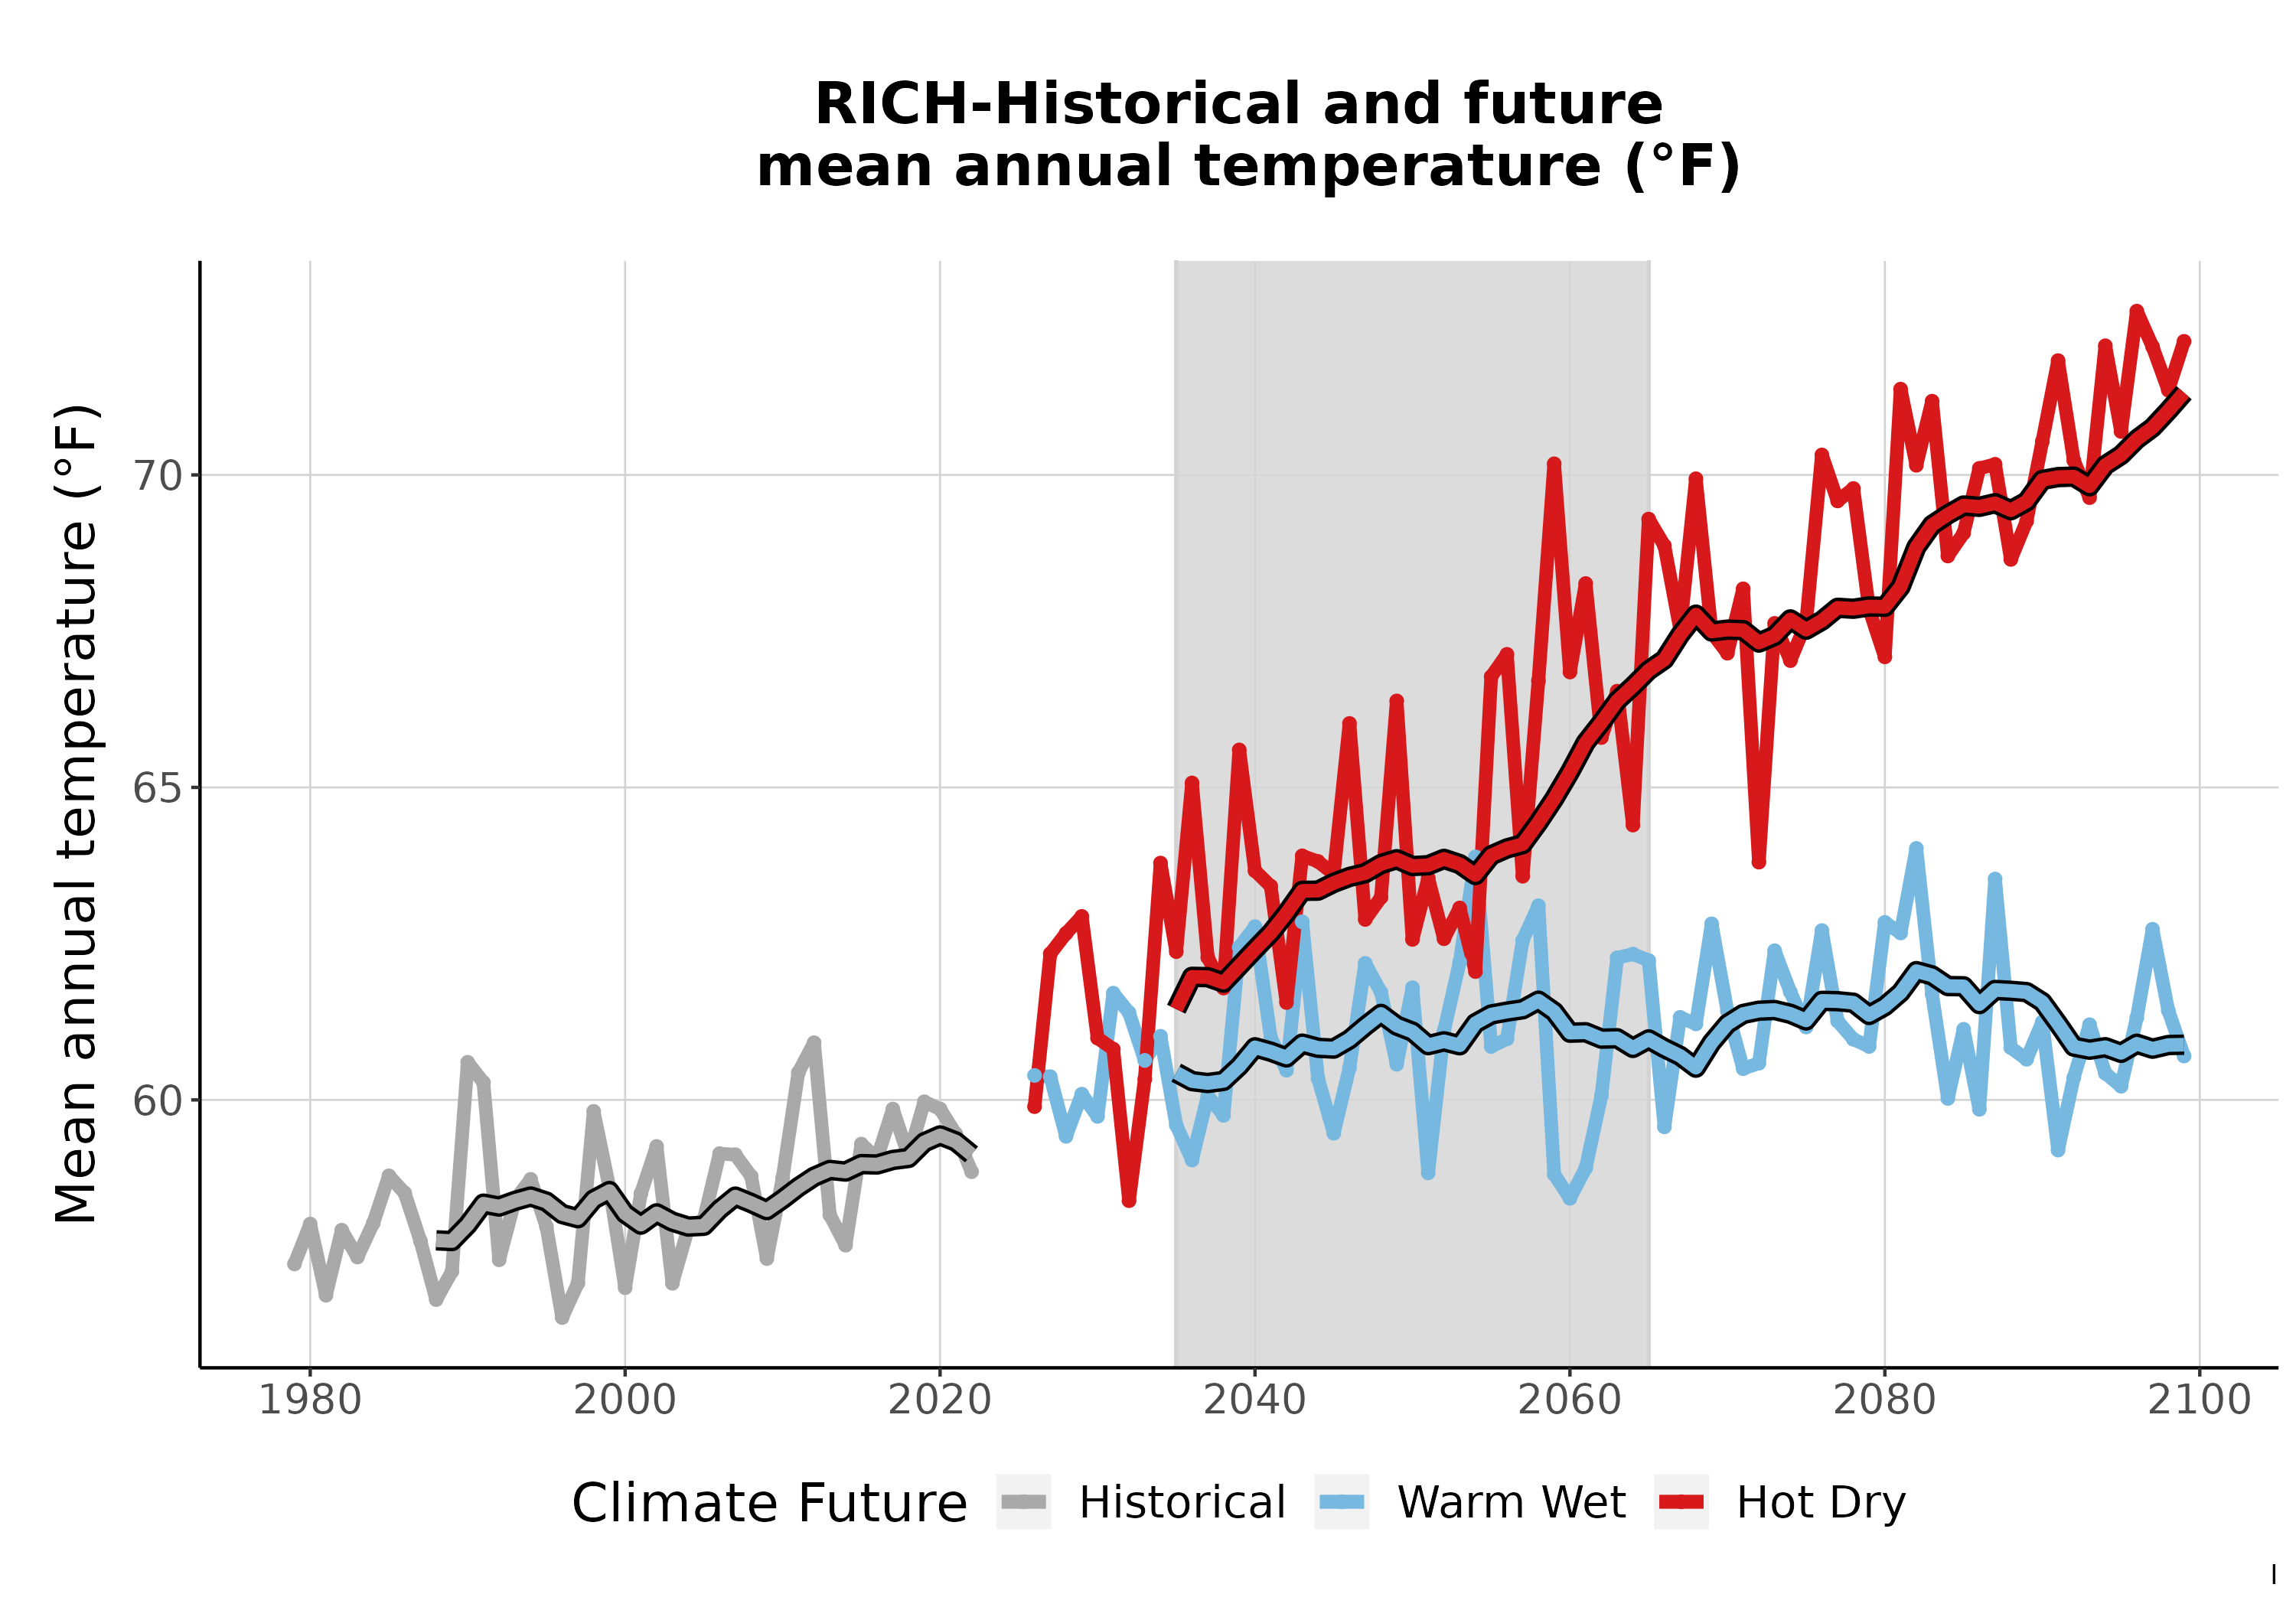
Click the image to see a larger version. This line graph compares average annual temperature (degrees Fahrenheit) historically (1979-2012) with predicted average annual temperature for the two climate futures over a range of future years (2023-2099). More information
(06/11)
<<Prev
Index
Next>>