|
|
|
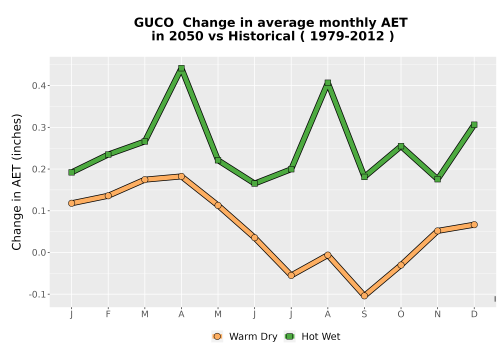
Click the image to see a larger version. Change in monthly (x-axis: January – December) Actual Evapotranspiration (AET) from historical to two possible futures More information |
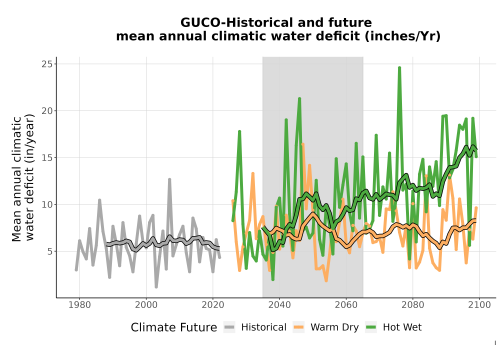
Click the image to see a larger version. Climatic water deficit is a measure indicating the amount by which potential evapotranspiration exceeds actual evapotranspiration. It is associated with conditions that make plants wilt. More information |
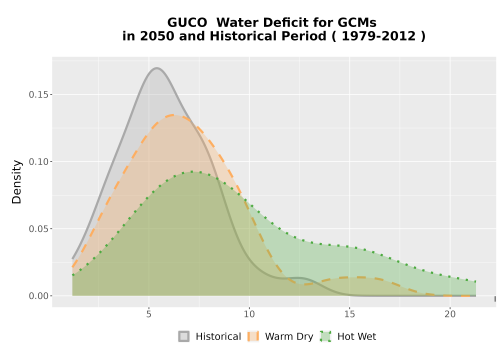
Click the image to see a larger version. Density (chance of occurrence) of daily water deficit values. More information |
|
|
|
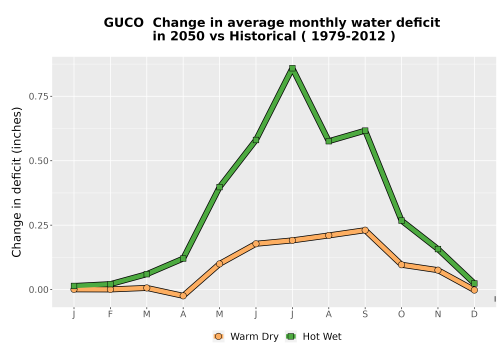
Click the image to see a larger version. Change in monthly (x-axis: January – December) water deficit historical vs two possible futures More information |
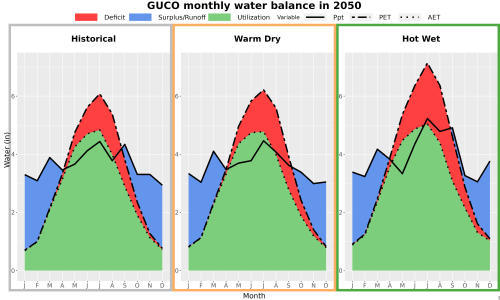
Click the image to see a larger version. Seasonal patterns in monthly (x-axis: January – December) water balance parameters. More information |
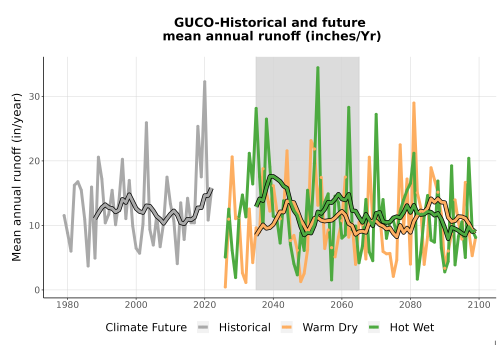
Click the image to see a larger version. Projected trends in runoff: historical vs two possible futures. More information |
|
|
|
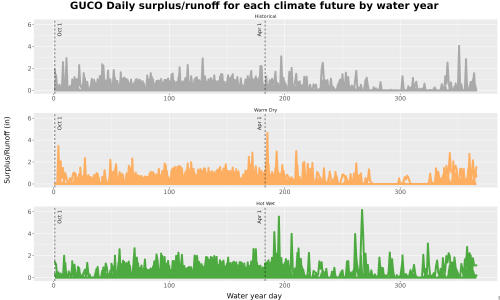
Click the image to see a larger version. Water year (October – September) runoff. Overlapping lines represent individual years. More information |
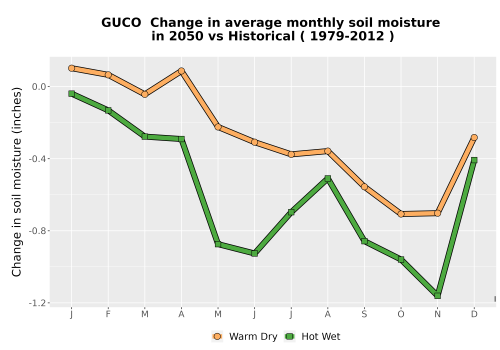
Click the image to see a larger version. Change in monthly (x-axis: January – December) soil moisture: historical vs two possible futures. More information |
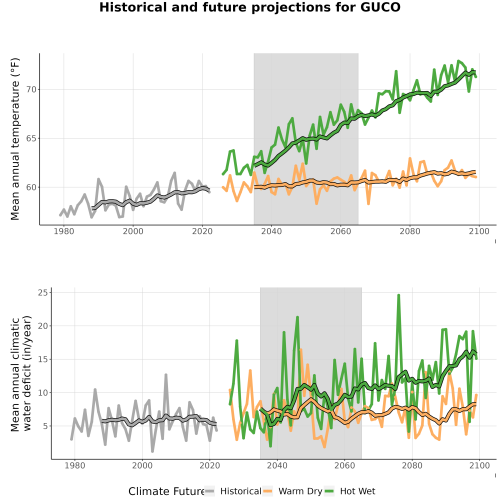
Click the image to see a larger version. Projected trends in annual average temperature and moisture deficit: historical vs two possible futures. More information |
|
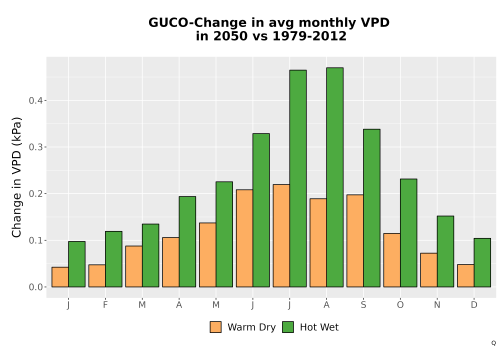
Click the image to see a larger version. Change in monthly (x-axis: January – December) vapor pressure deficit (VPD). More information |