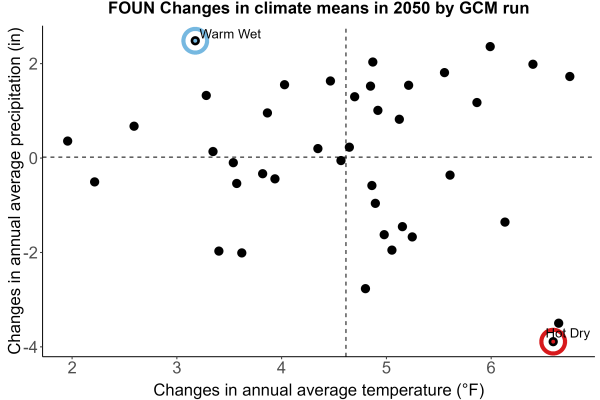
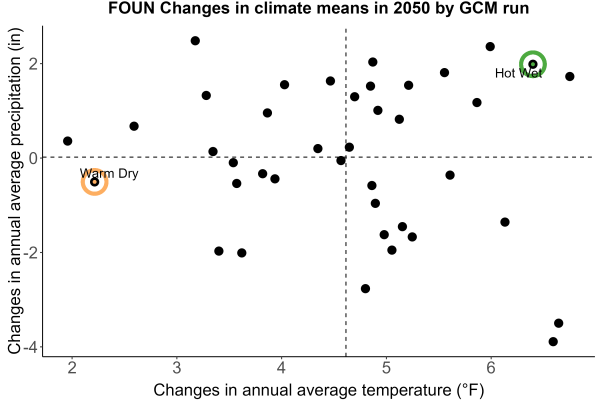
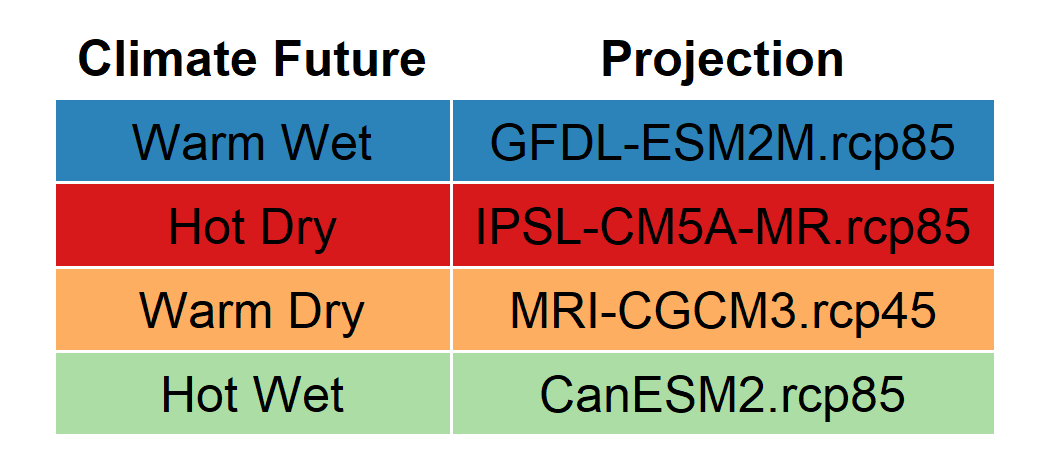
Fort UnionChoose your contrasting pair of climate futures: Warm Wet vs. Hot Dry (blue button) OR Warm Dry vs. Hot Wet (red button). The scatterplots below show a range in future climate projections at this park, where each dot represents a plausible climate future. Uncertainty is due to both variation in the GCM climate model and the emission scenario (business as usual or CO2 reductions) used in each climate future projection. We use contrasting climate futures to characterize a plausible range of climate projections. In areas or for resources where water limitations can be an issue, the Warm Wet/Hot Dry pair often illustrate best and worst case futures. This is most often the most relevant pair of contrasting climate futures for natural resources, however in eastern regions, where flooding and humidity impacts are severe, the Warm Dry/Hot Wet pair can better illustrate best and worst case scenarios. Click Here to see the projections (global climate model + emissions scenario) selected (circled in the scatterplots). These projections are selected for each park because they bracket most of the range of plausible futures.
|
|
Click the image to see a larger version. Scatter plot showing the choice of Warm-Wet and Hot-Dry futures compared to the other options. More information |
Click the image to see a larger version. Scatter plot showing the of choice Warm-Dry and Hot-Wet futures compared to the other options. More information |

|
|
| WarmWet_HotDry |
WarmDry_HotWet |
created with llgal