<<Prev
Index
Next>>
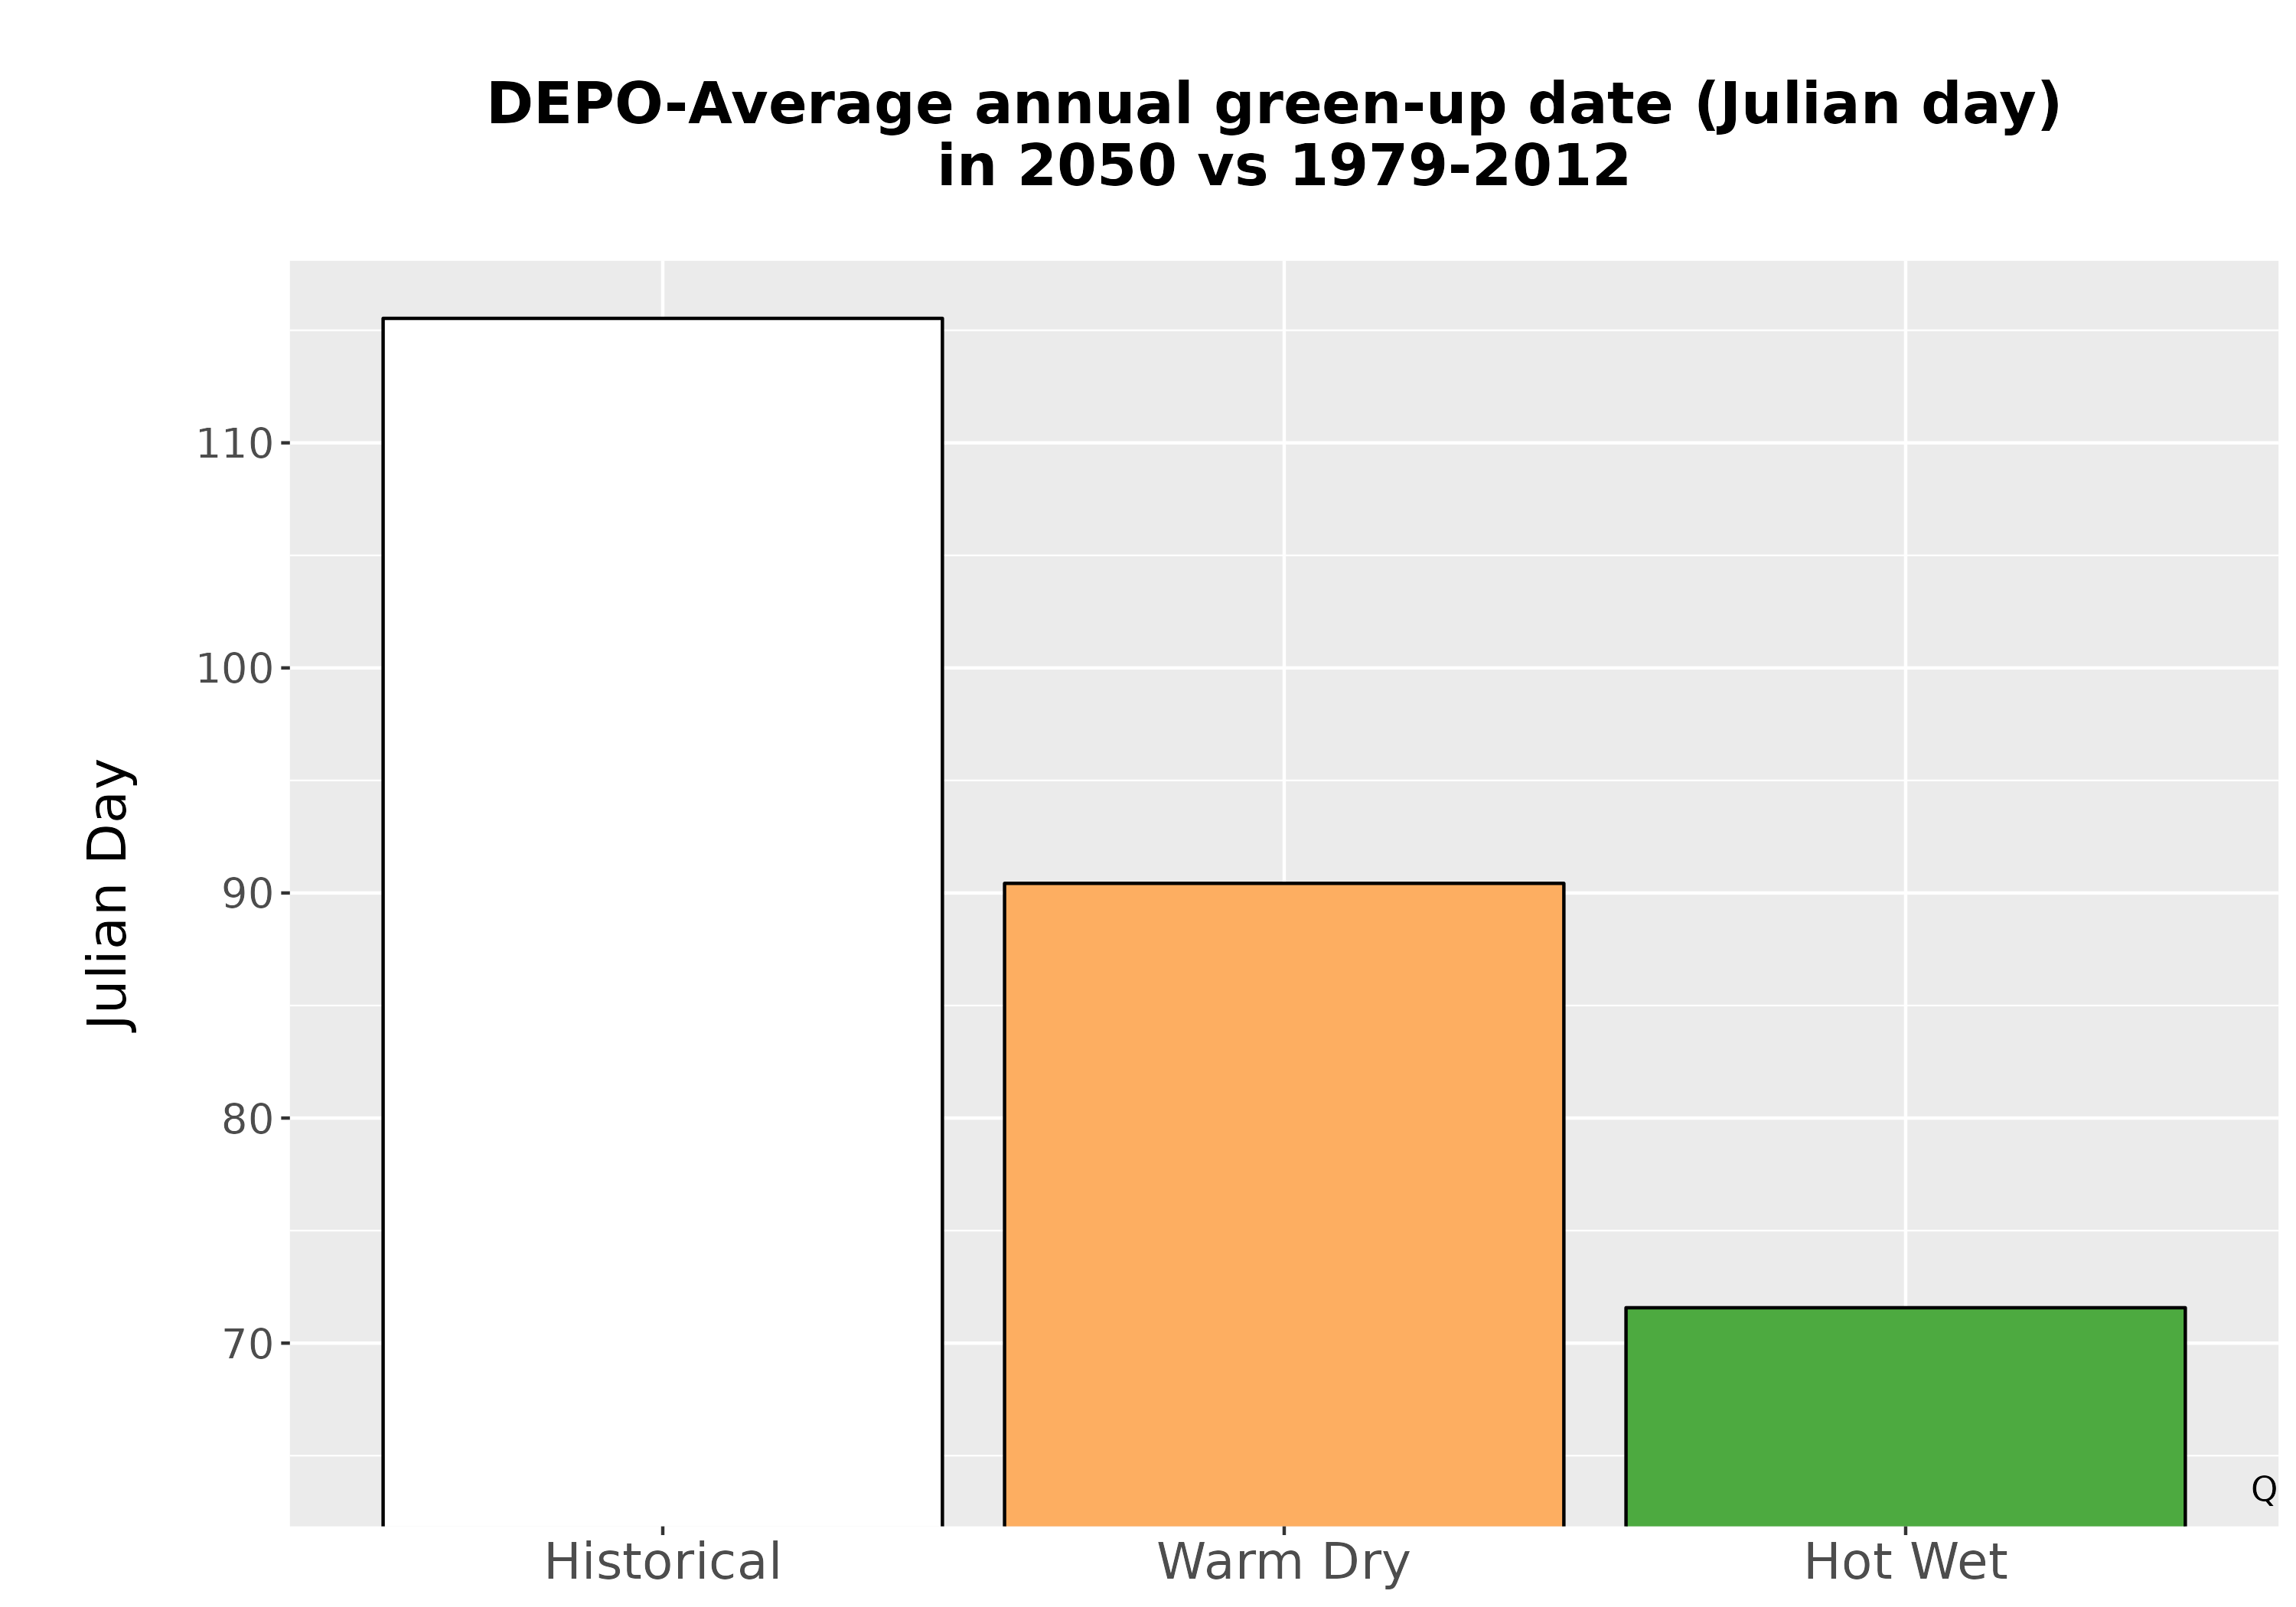
Click the image to see a larger version. Green-up dates indicate the average annual start to a new cycle of plant growth after the dormant winter months. This bar graph displays the average annual green-up date historically (1979-2012) and in 2050 under two possible climate futures. The dates are displayed in Julian days. More information
(05/11)
<<Prev
Index
Next>>