<<Prev
Index
Next>>
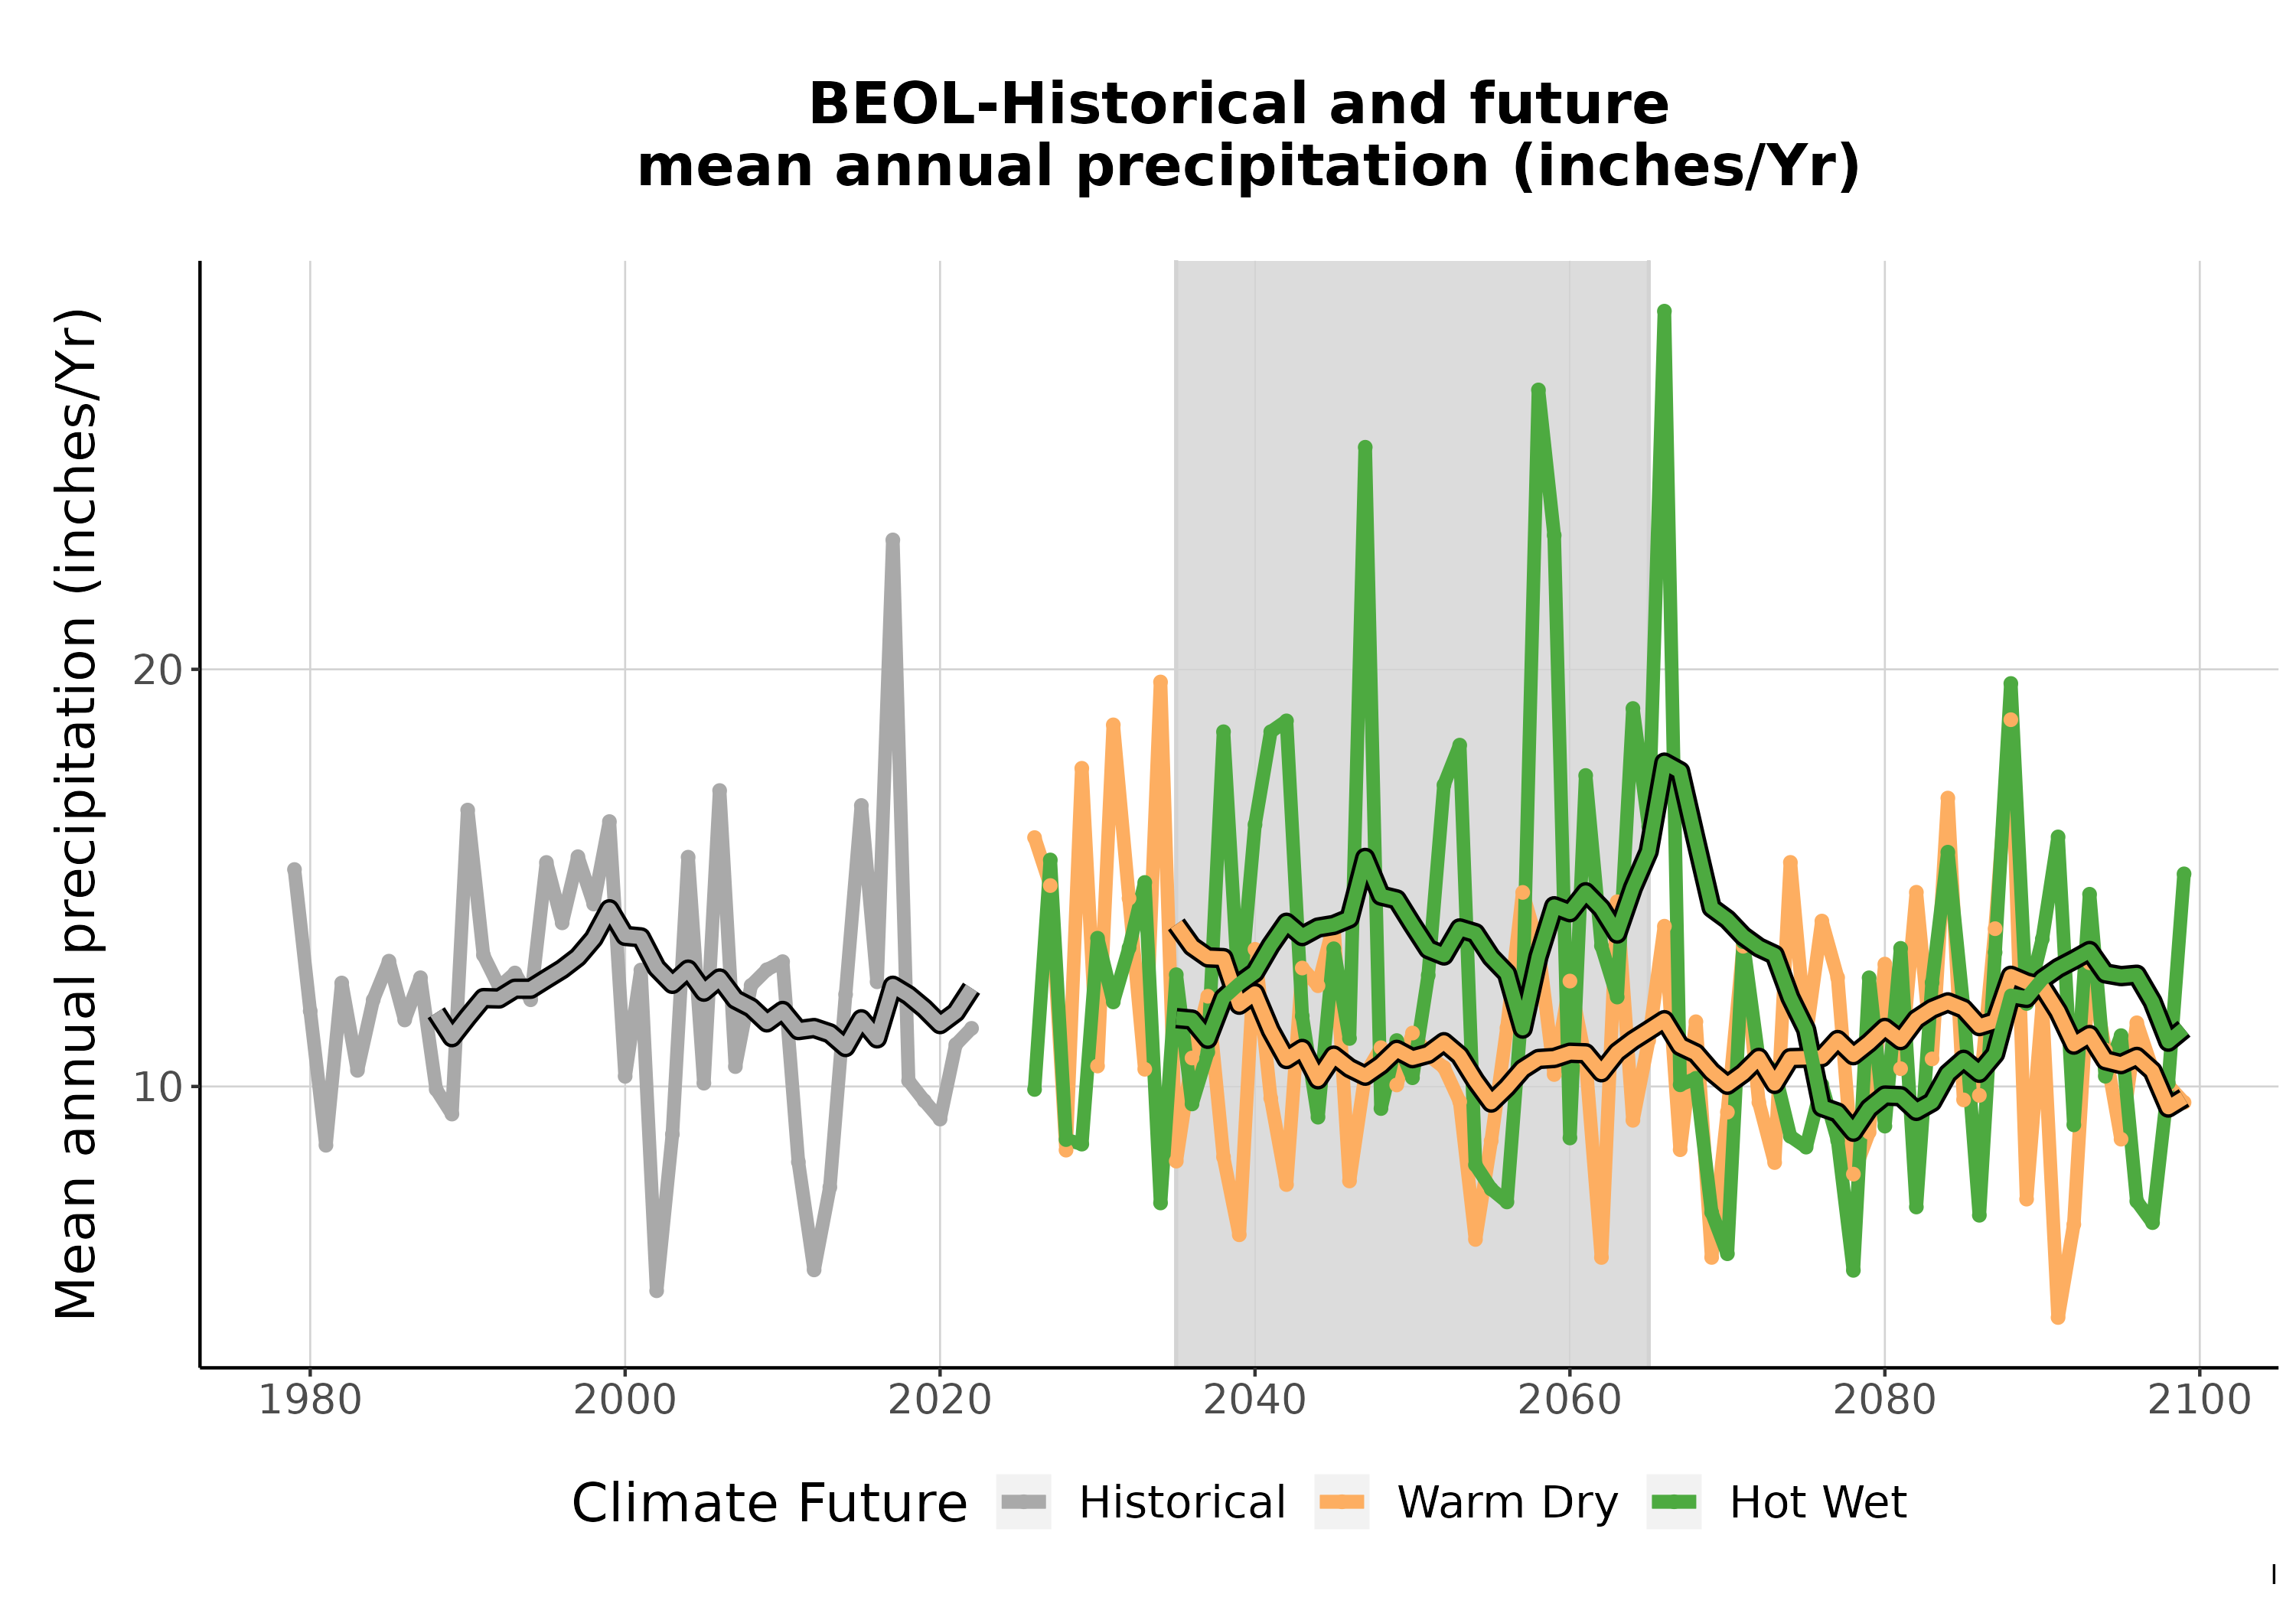
Click the image to see a larger version. Historical and projected trends in total annual precipitation. Bold lines are 10-year running means. Unbolded lines show annual data.
More information
(1/6)
<<Prev
Index
Next>>