<<Prev
Index
Next>>
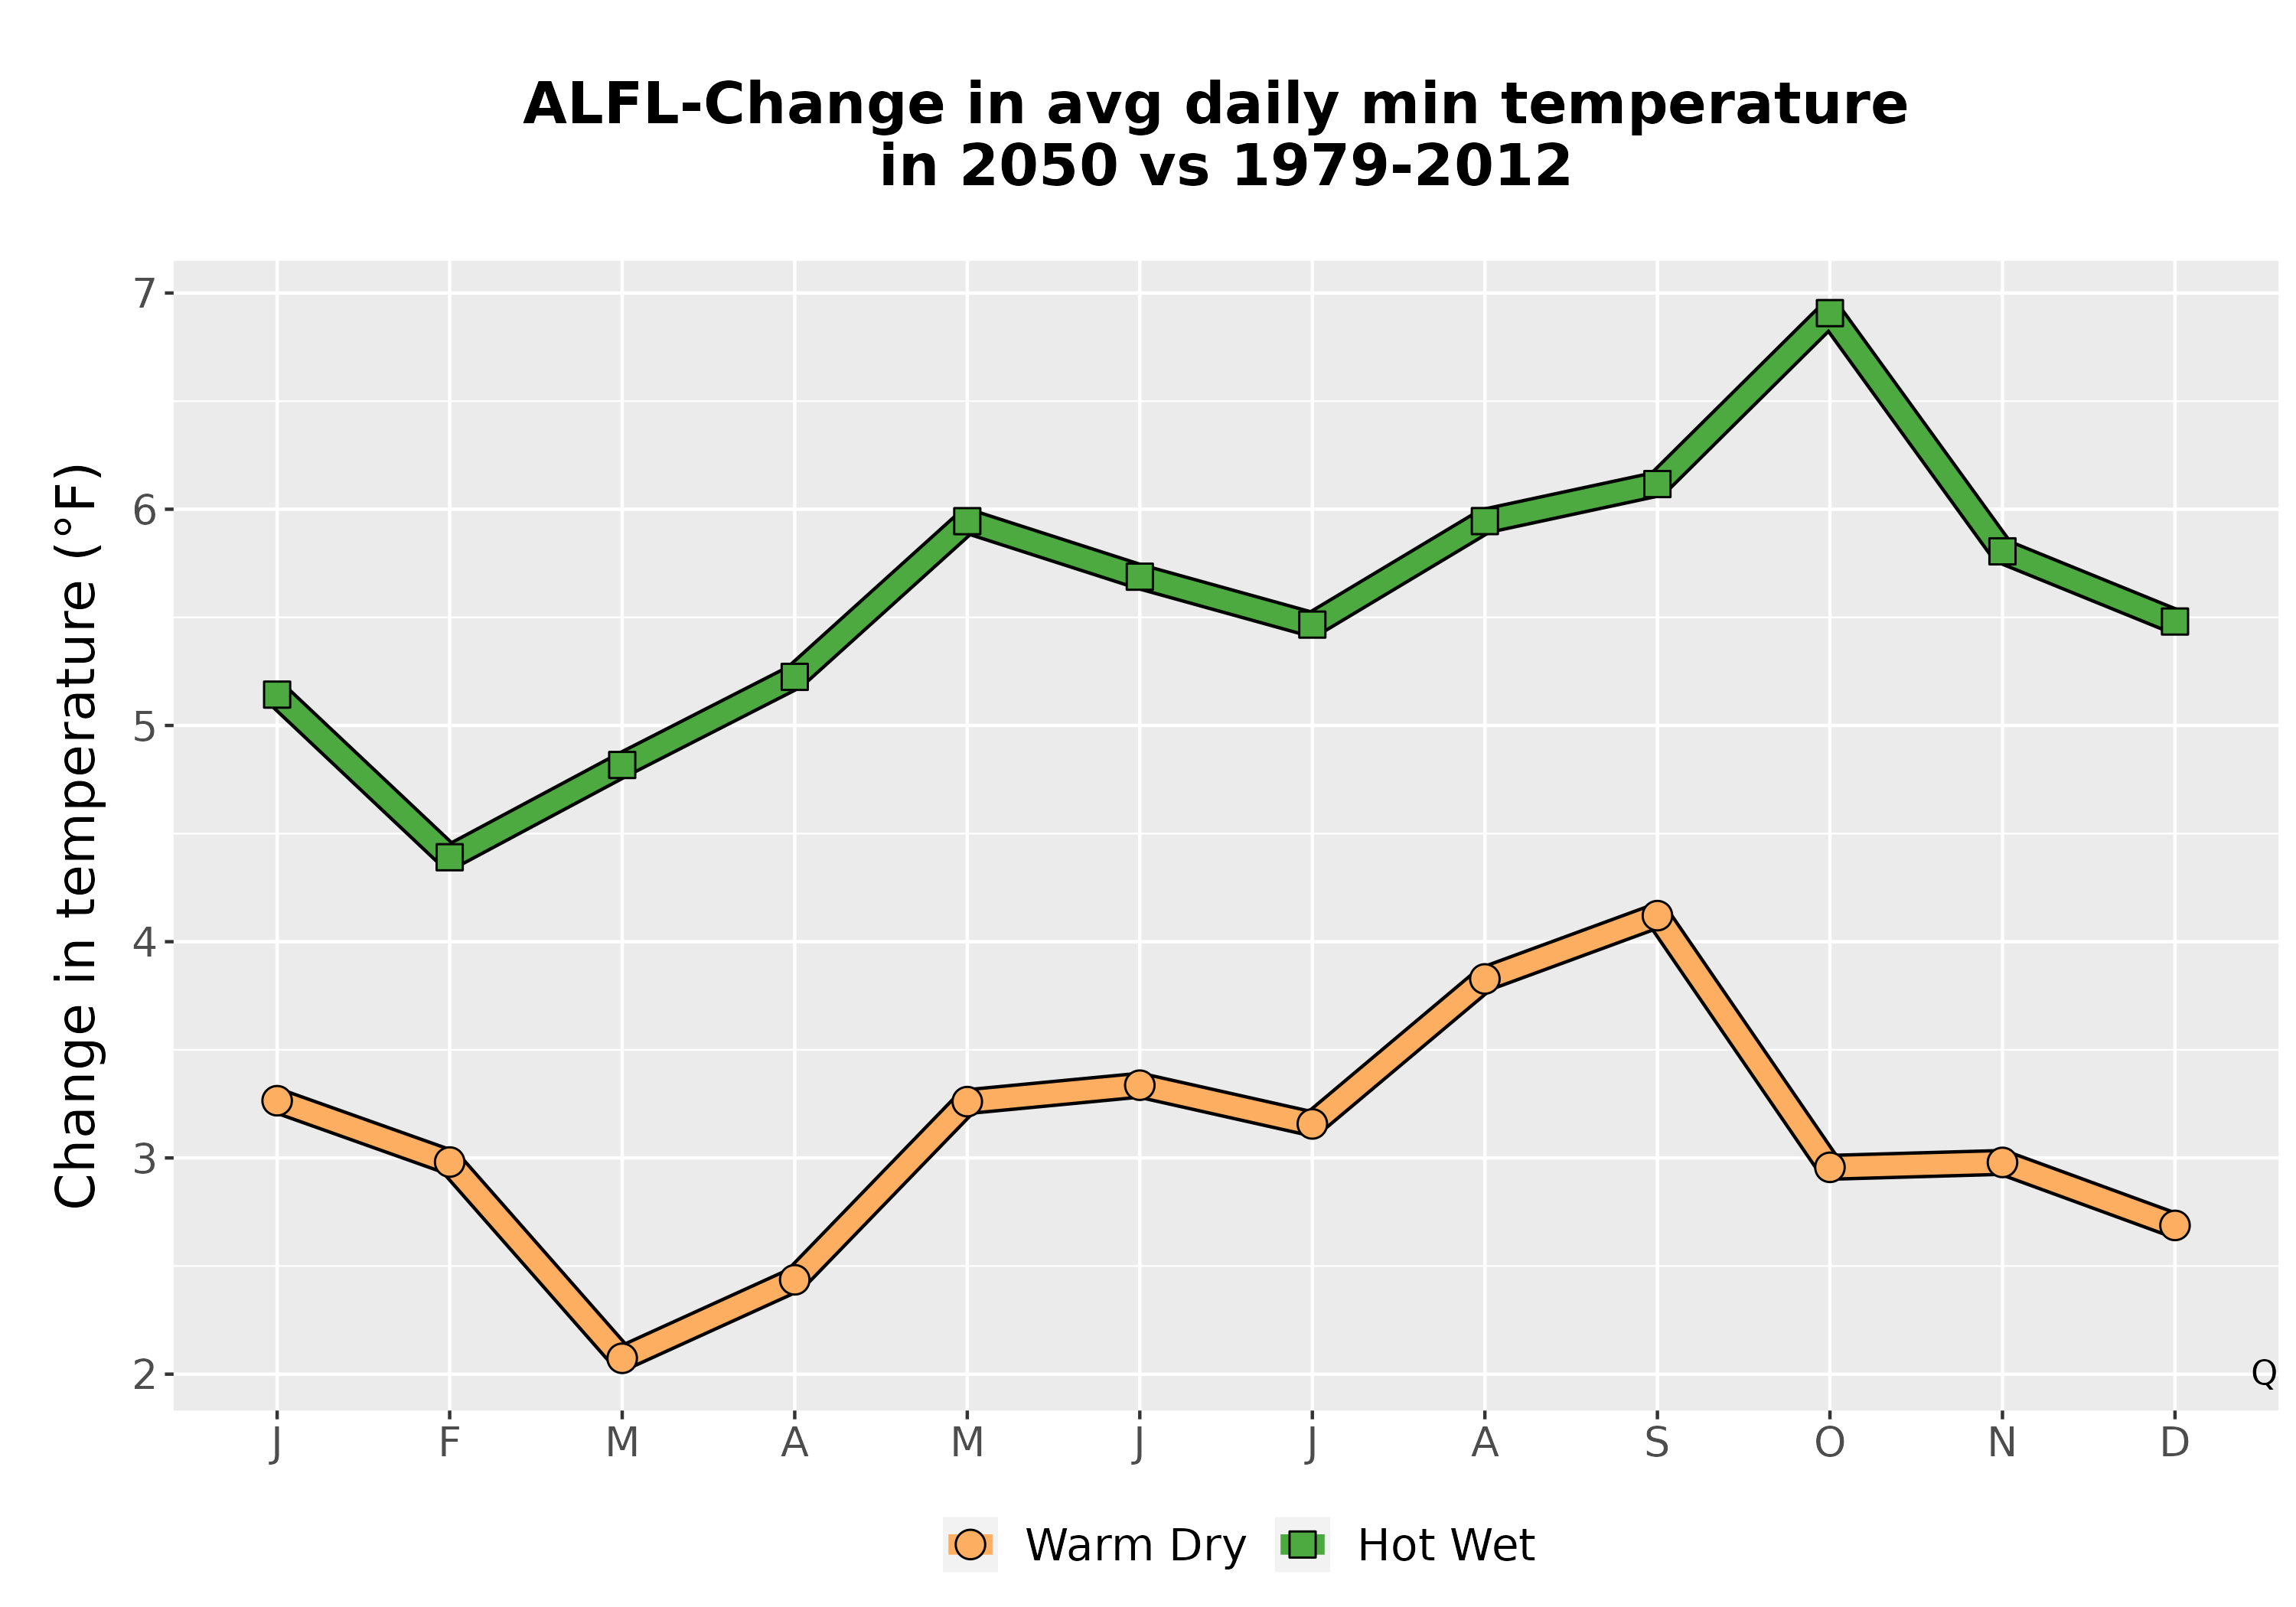
Click the image to see a larger version.This line graph shows the change in monthly minimum temperatures for the two possible climate futures (2050).
More information
(11/11)
<<Prev
Index
Next>>