<<Prev
Index
Next>>
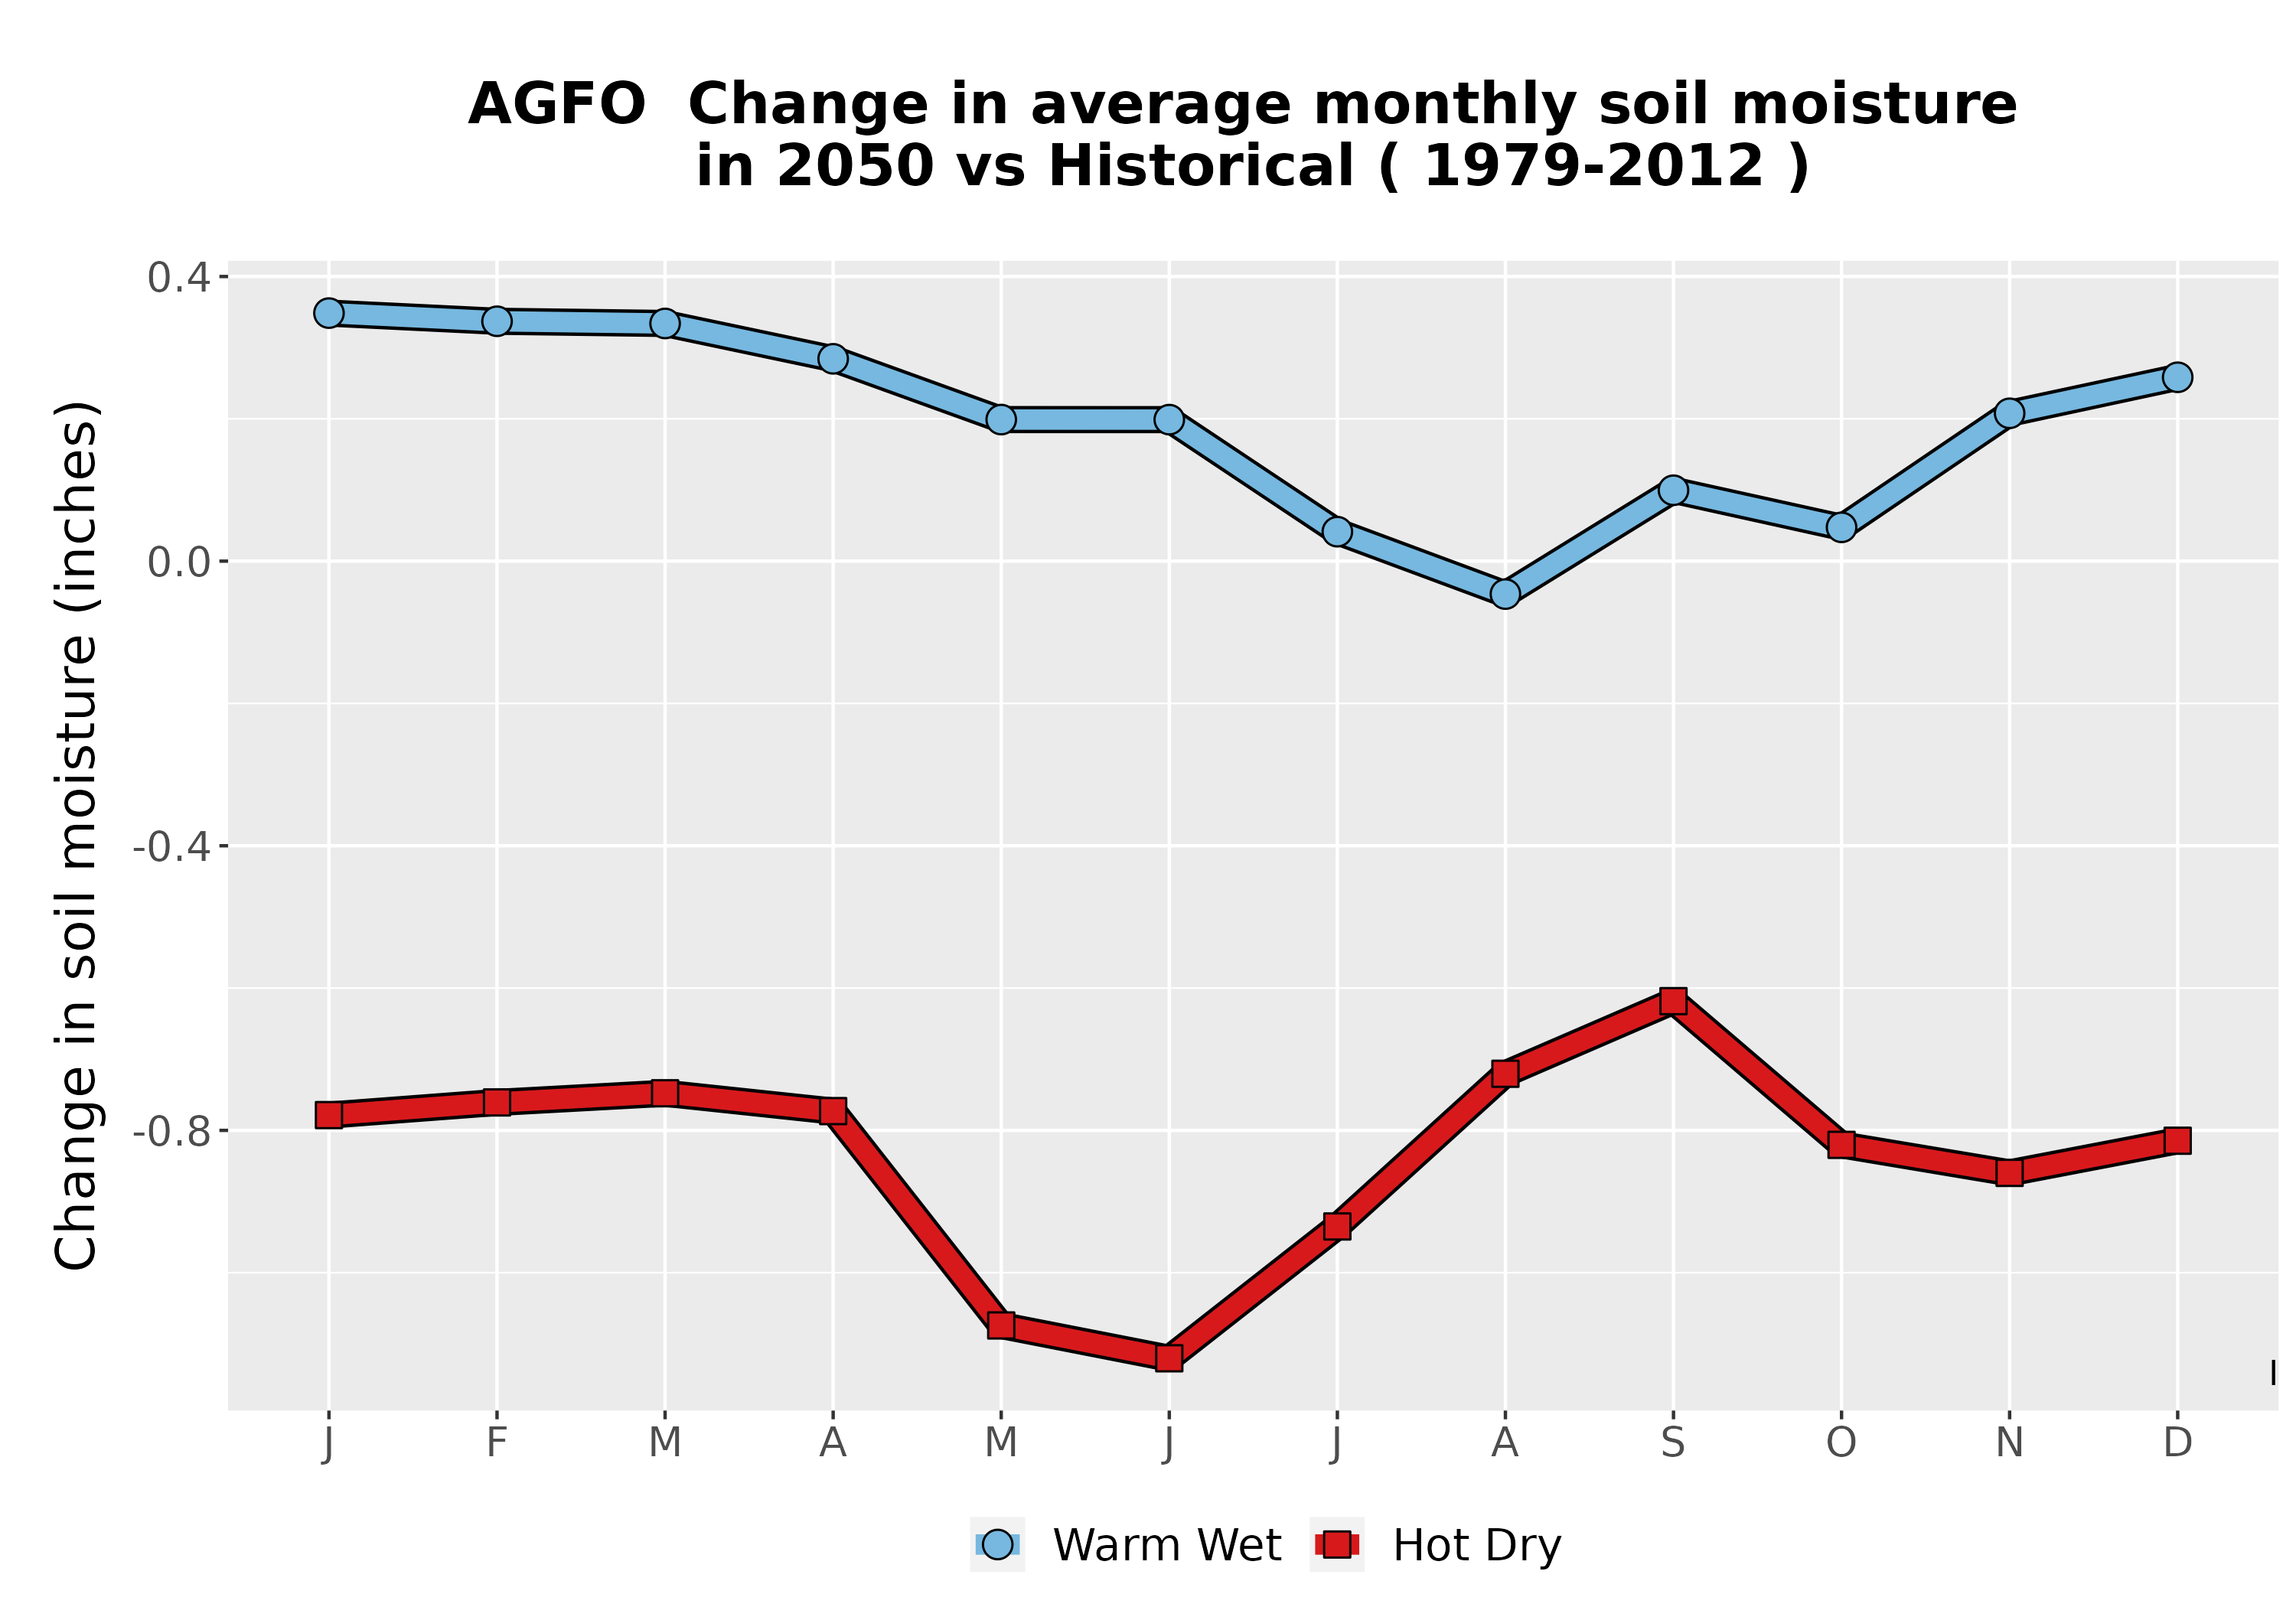
Click the image to see a larger version. Change in monthly (x-axis: January – December) soil moisture: historical vs two possible futures.
More information
(08/10)
<<Prev
Index
Next>>