|
|
|
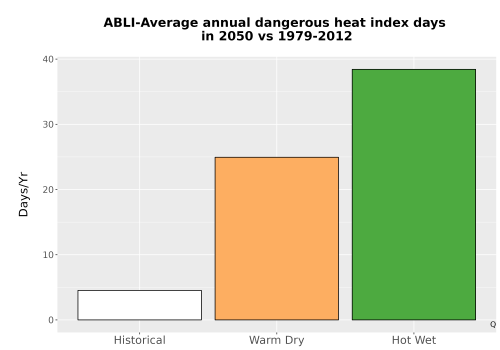
Click the image to see a larger version. Average number of dangerously hot days per year historically (1979-2012) and for the two climate futures (2050). Dangerous heat index days are days that exceed 103 degrees F. More information |
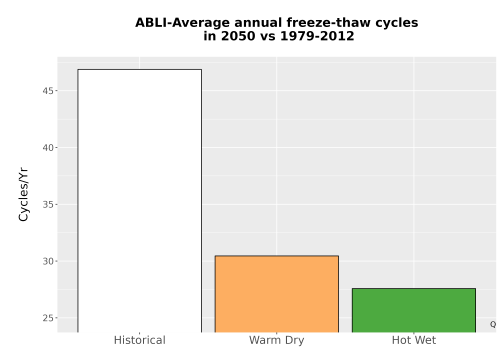
Click the image to see a larger version. Average number of annual freeze-thaw cycles (cycles/year) historically (1979-2012) and for the two climate futures (2050). More information |
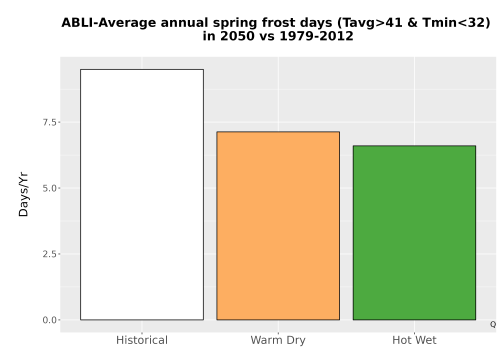
Click the image to see a larger version. Number of days per year with frost risk. More information |
|
|
|
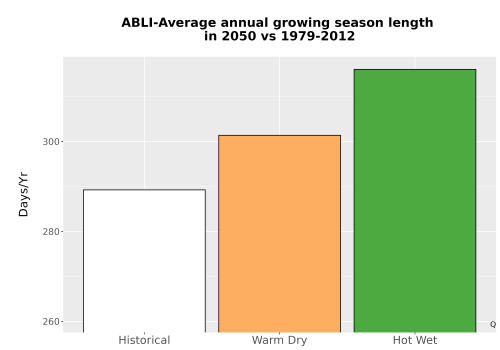
Click the image to see a larger version. Average annual growing season length (days/year) historically (1979-2012) and for the two climate futures (2050). More information |
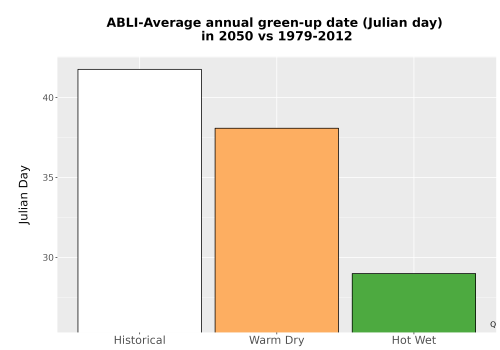
Click the image to see a larger version. Green-up dates indicate the average annual start to a new cycle of plant growth after the dormant winter months. This bar graph displays the average annual green-up date historically (1979-2012) and in 2050 under two possible climate futures. The dates are displayed in Julian days. More information |
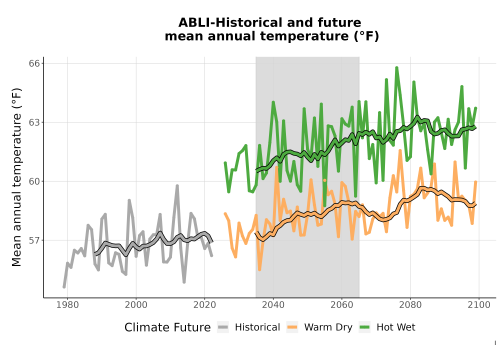
Click the image to see a larger version. This line graph compares average annual temperature (degrees Fahrenheit) historically (1979-2012) with predicted average annual temperature for the two climate futures over a range of future years (2023-2099). More information |
|
|
|
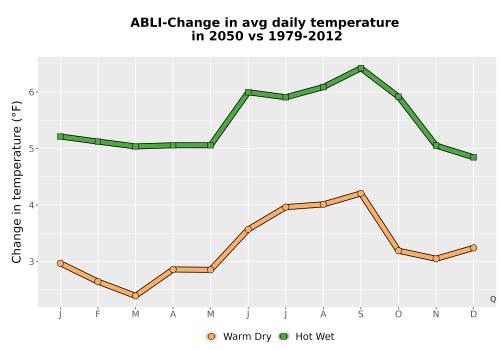
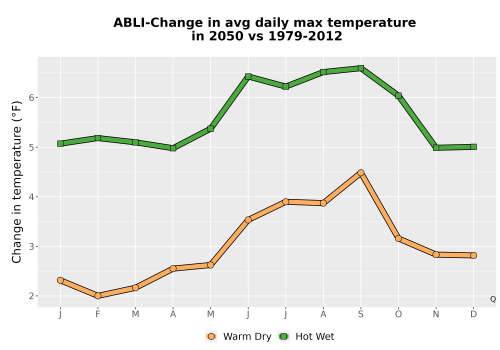
Click the image to see a larger version.This line graph shows the change in average monthly temperatures for the two possible climate futures (2050). More information |
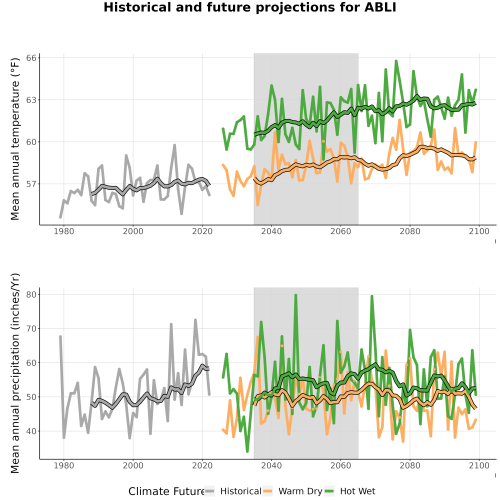
Click the image to see a larger version. Projected trends in average annual temperature and annual precipitation for the two possible climate futures (2050). More information |
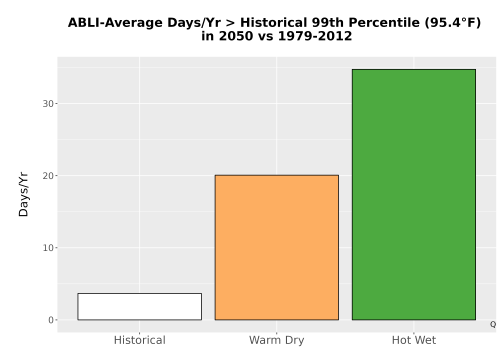
Click the image to see a larger version. Days per year greater than the 99th percentile temperature. More information |
|
|
Click the image to see a larger version. This line graph shows the change in monthly monthly temperatures for the two possible climate futures (2050). More information |
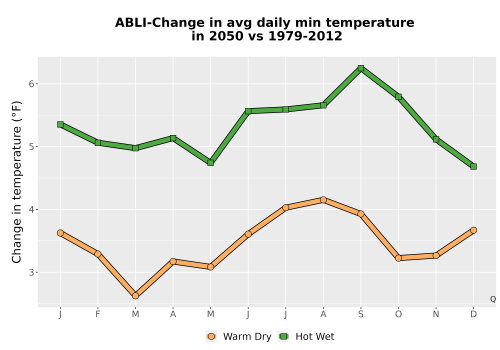
Click the image to see a larger version.This line graph shows the change in monthly minimum temperatures for the two possible climate futures (2050). More information |